Working with TipRanks
Follow Us


Stocks
ETFs
Options
Commodities
Crypto
Currency
Research Tools
Calendars
Economic Indicators
Calculators
Education
About Us
Working with TipRanks
Follow Us
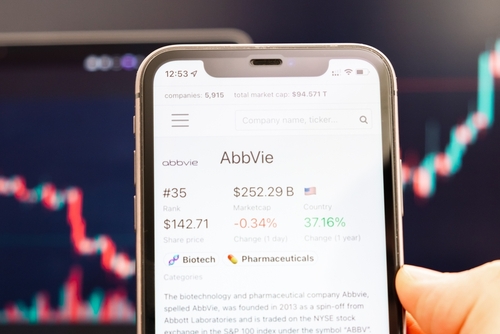
AbbVie (ABBV)
NYSE:ABBV
AbbVie (ABBV) Stock Price & Analysis
19,990 Followers
ABBV Stock Chart & Stats
Day’s Range$0 - $0
52-Week Range$125.85 - $181.20
Previous Close$159.62
Volume10.72M
Average Volume (3M)5.71M
Market Cap
$282.63B
Enterprise Value$329.24B
Total Cash (Recent Filing)$12.82B
Total Debt (Recent Filing)$59.38B
Price to Earnings (P/E)58.7
Beta0.37
Next Earnings
Jul 26, 2024EPS Estimate
$2.87Last Dividend Ex-Date
Apr 12, 2024Dividend Yield3.58%
Share Statistics
EPS (TTM)2.72
Shares Outstanding1,766,473,359
10 Day Avg. Volume5,499,432
30 Day Avg. Volume5,711,742
Standard Deviation0.07
R-Squared0.19
Alpha0.01
Financial Highlights & Ratios
Price to Book (P/B)-3.81
Price to Sales (P/S)5.19
Price to Cash Flow (P/CF)15.50
P/FCF Ratio15.00
Enterprise Value/Market CapN/A
Enterprise Value/Revenue6.06
Enterprise Value/Gross Profit9.71
Enterprise Value/Ebitda20.55
Forecast
1Y Price Target
$179.77Price Target Upside12.62% Upside
Rating ConsensusStrong Buy
Number of Analyst Covering15
AbbVie News


Bulls Say, Bears Say
Bulls Say
Market ExpansionAlvotech announced a long-term agreement to enhance access to Adalimumab-ryvk in the U.S. market.
Product Approval & Market Fit'951 has been approved in the EU and Japan, supporting positive outcomes for upcoming PDUFA.
Strategic AcquisitionAbbVie's acquisition of Landos at a significant premium reflects a strong belief in the strategic value and growth potential Landos brings to the company.
Bears Say
Competition ImpactHeme-onc sales could slightly miss due to competition, with Imbruvica and Venclexta demand softer year over year.
Earnings ForecastTotal Revenue for 1Q24 is projected to show a 2% decrease according to the latest consensus estimates.
Product PerformanceSandoz’s biosimilar Humira, Hyrimoz, has stepped up dramatically in recent weeks, driven by CVS’s hard switch for part of its patient base.
---
Ownership Overview
0.27% Insiders
21.66% Mutual Funds
21.92% Other Institutional Investors
56.16% Public Companies and Individual Investors
Risk Analysis
Main Risk Category
Finance & CorporateFinancial and accounting risks. Risks related to the execution of corporate activity and strategy
Website Traffic
 Sorry, No Data Available
There is no website visitor data available for this stock.
---
ABBV FAQ
What was AbbVie’s price range in the past 12 months?
AbbVie lowest stock price was $125.85 and its highest was $181.20 in the past 12 months.
What is AbbVie’s market cap?
Currently, no data Available
When is AbbVie’s upcoming earnings report date?
AbbVie’s upcoming earnings report date is Jul 26, 2024 which is in 89 days.
How were AbbVie’s earnings last quarter?
AbbVie released its earnings results on Apr 26, 2024. The company reported $2.31 earnings per share for the quarter, beating the consensus estimate of $2.26 by $0.05.
Is AbbVie overvalued?
According to Wall Street analysts AbbVie’s price is currently Undervalued.
Does AbbVie pay dividends?
AbbVie pays a Quarterly dividend of $1.55 which represents an annual dividend yield of 3.58%. See more information on AbbVie dividends here
What is AbbVie’s EPS estimate?
AbbVie’s EPS estimate is $2.87.
How many shares outstanding does AbbVie have?
AbbVie has 1,770,647,000 shares outstanding.
What happened to AbbVie’s price movement after its last earnings report?
AbbVie reported an EPS of $2.31 in its last earnings report, beating expectations of $2.26. Following the earnings report the stock price went down -4.585%.
Which hedge fund is a major shareholder of AbbVie?
Among the largest hedge funds holding AbbVie’s share is Diamond Hill Capital Management Inc. It holds AbbVie’s shares valued at 208M.
---
AbbVie Stock Smart Score
Outperform
1
2
3
4
5
6
7
8
9
10
Analyst Consensus
Strong Buy
Average Price Target:
$179.77 (12.62% Upside)
$179.77 (12.62% Upside)
Blogger Sentiment
Bullish
ABBV Sentiment 94%
Sector Average 70%
Sector Average 70%
Hedge Fund Trend
Increased
By 208.9K Shares
Last Quarter.
Last Quarter.
Insider Transactions
Sold Shares
Worth $81.6M over
the Last 3 Months
the Last 3 Months
Crowd Wisdom
Positive
Last 7 Days ▲ 0.3%
Last 30 Days ▲ 1.1%
Last 30 Days ▲ 1.1%
News Sentiment
Neutral
Bullish news 50%
Bearish news 50%
Bearish news 50%
Company Description
AbbVie
AbbVie, Inc. is a biopharmaceutical company focused on key therapeutic areas like immunology, oncology, neuroscience, eye care, virology, women's health and gastroenterology. The company was founded on October 19, 2011 and is headquartered in North Chicago, IL.
---
ABBV Earnings Call
Q1 2024
0:00 / 0:00
---
ABBV Net revenue Breakdown
48.12% Immunology
14.21% Neuroscience
12.59% Other Key Products
10.89% Oncology
14.19% Other
---
ABBV Stock 12 Months Forecast
Average Price Target
$179.77
▲(12.62% Upside)
Technical Analysis
Best Analysts Covering ABBV
1 Year
1 Year Success Rate
32/36 ratings generated profit
1 Year Average Return
+21.81%
reiterated a buy rating 7 days ago
Copying Christopher Raymond's trades and holding each position for 1 Year would result in 88.89% of your transactions generating a profit, with an average return of +21.81% per trade.
---